Employee Hierarchy Chart
Overview
The Employee Hierarchy Chart shows your company's reporting structure: who reports to whom, starting from the company and going down through every manager to their team members. It is an interactive, read-only chart.
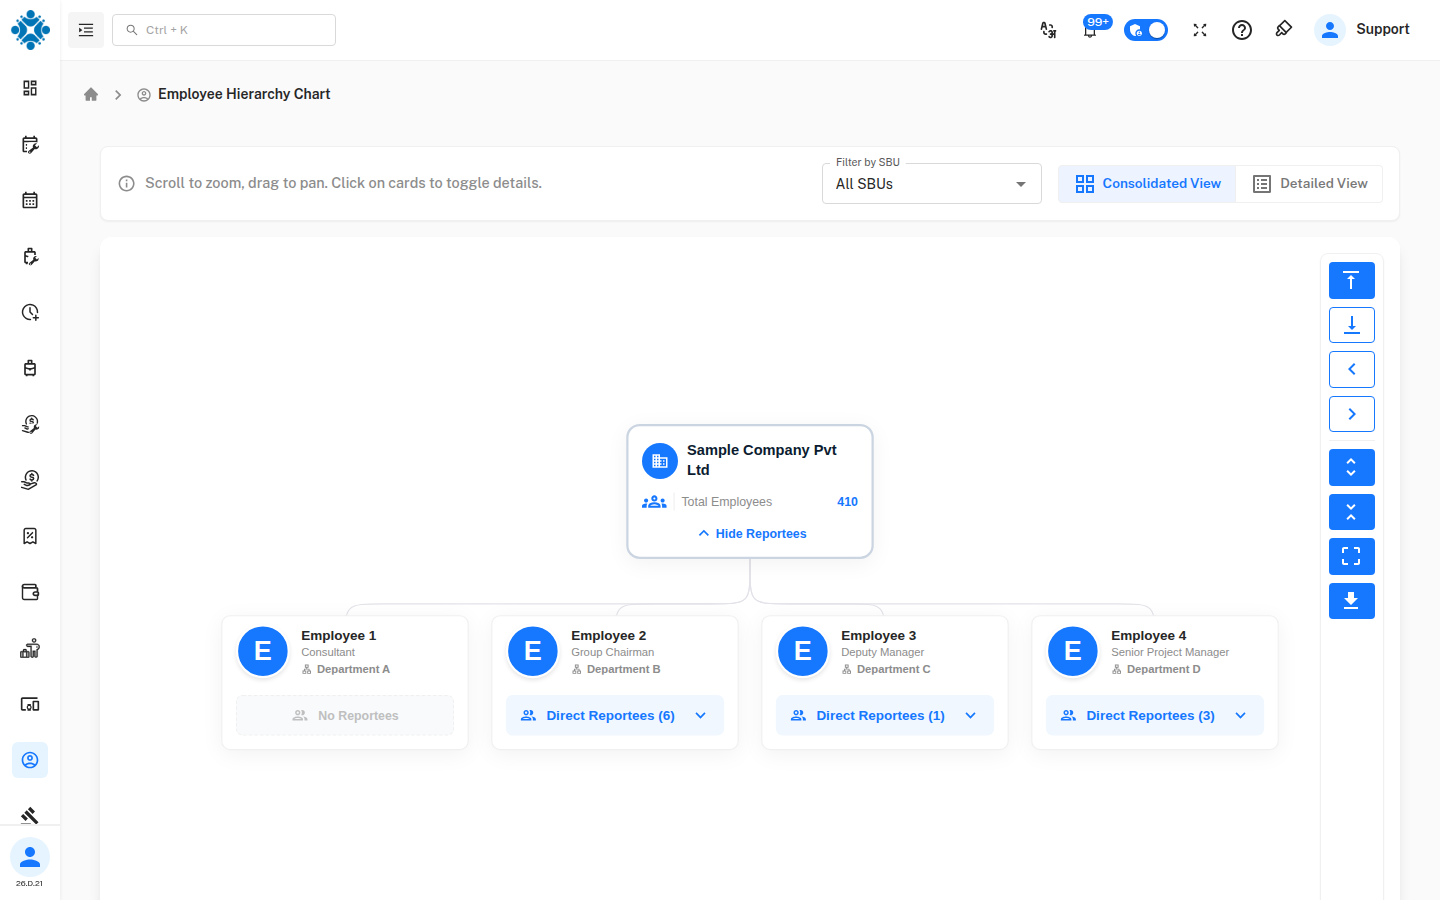
Use it to:
- See the reporting line above and below any employee
- Check how many people report to a manager, directly and in total
- Focus on one SBU instead of the whole company
- Choose which employee details appear on the cards
- Export the chart as an image
That separate page no longer exists. The same settings are now part of the chart itself, under Customise Chart. See Customise Chart.
This chart is about people and their managers. The Organization Chart is about organizational units (company, SBUs and departments).
1. Where to Find It
Open Employees → Employee Hierarchy Chart from the menu.
The page appears only if your role has the Employee Hierarchy Chart permission. If you cannot see it, ask your administrator to enable it for your role in Role Master.
2. The Page at a Glance
| Area | What it does |
|---|---|
| Hint bar | Reminds you that you can scroll to zoom and drag to move around |
| Filter by SBU | Limits the chart to one SBU |
| Consolidated View / Detailed View | Switches between compact cards and cards with more details |
| Chart area | Shows the reporting structure as connected cards |
| Control panel (right edge) | Changes the layout, expands or collapses the chart, fits it to the screen and exports it |
3. Reading the Chart
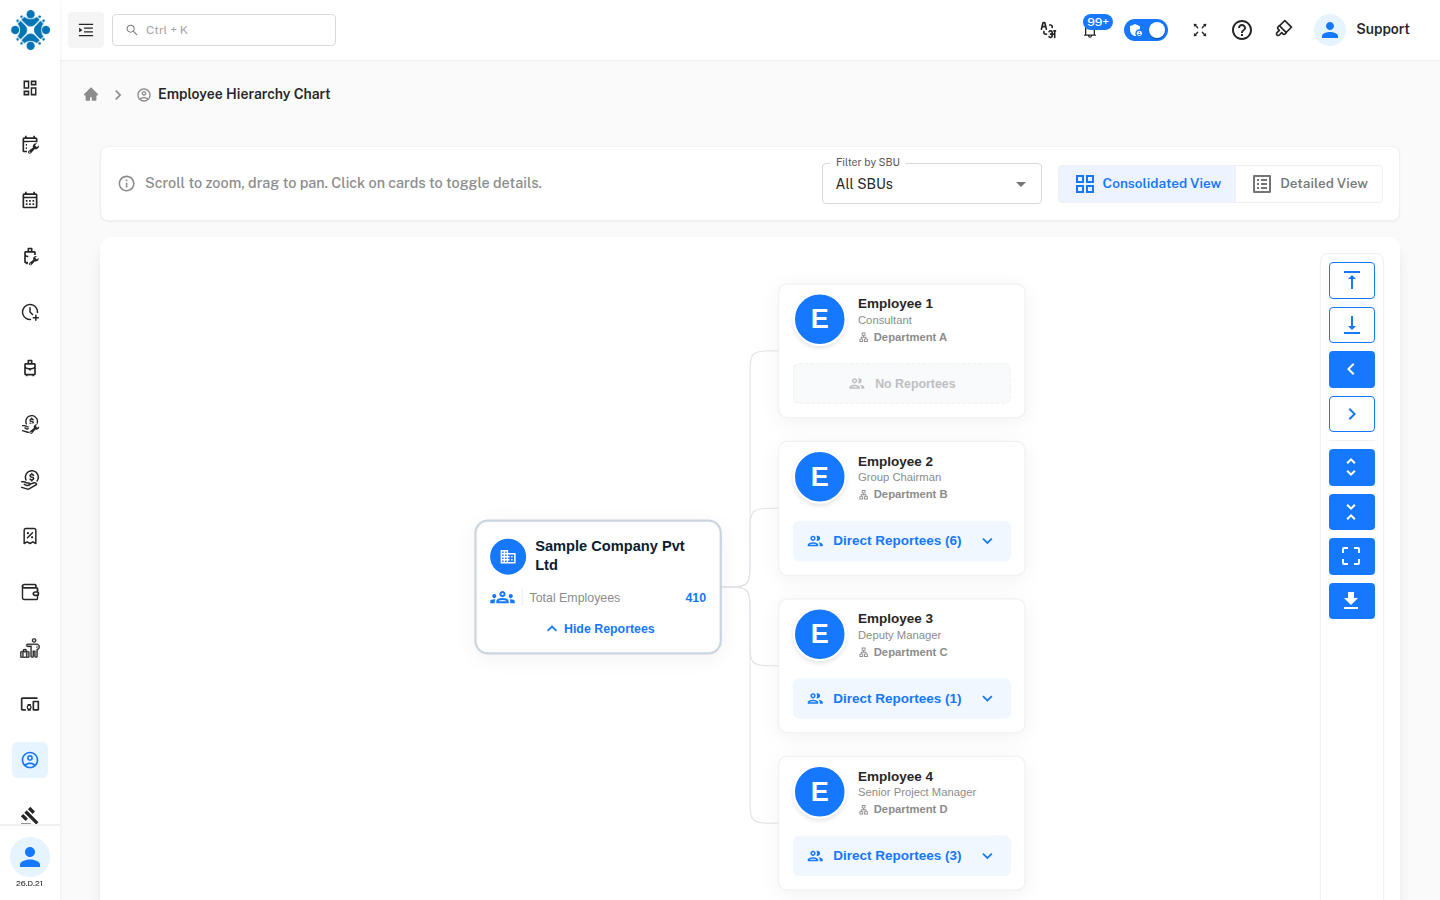
The chart starts with the company card at the top. Below it are the employees who sit at the top of the reporting structure.
The company card
| Item | Meaning |
|---|---|
| Company name | The root of the chart |
| Total Employees | Number of employees in the chart |
| Hide Reportees / Show Reportees | Closes or opens the first level under the company |
Employee cards
| Item | Meaning |
|---|---|
| Round picture | The employee's profile picture, or their initial if there is no picture |
| Name | The employee's name |
| Designation | The employee's job title |
| Department | The employee's department |
| Direct Reportees (n) | The number of employees who report directly to this person. Click it to open or close that team |
| No Reportees (greyed out) | This employee has nobody reporting to them |
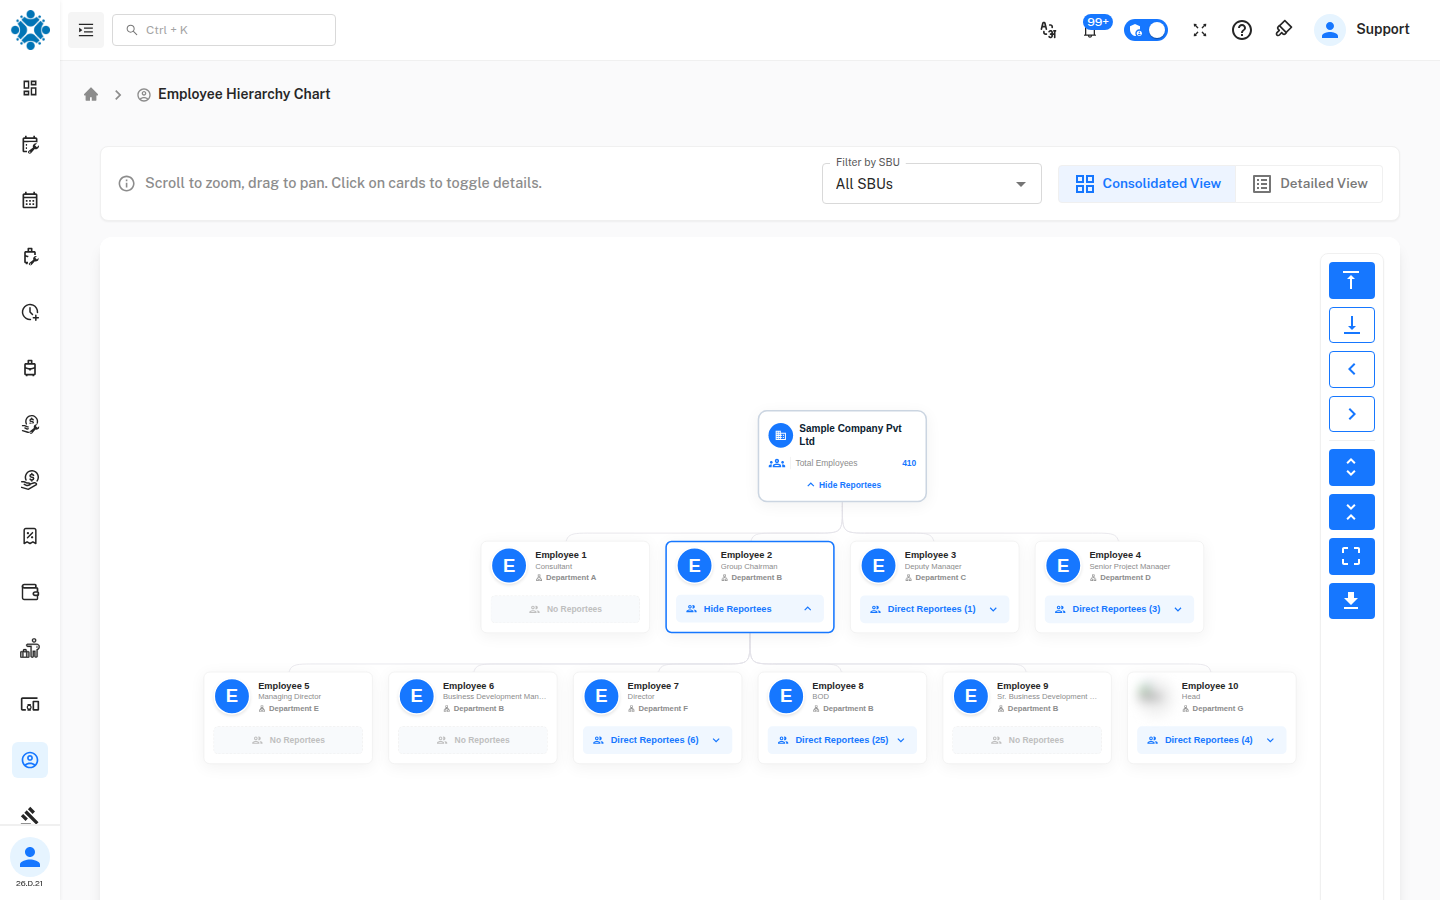
Open and close a team
- Click Direct Reportees (n) on a card to show the people who report to that employee. Click it again (Hide Reportees) to close them.
- Use Expand All and Collapse All in the control panel to open or close every team at once.
- Click a card to select it. The selected card is outlined in blue.
Move around a large chart
- Scroll over the chart to zoom in and out.
- Drag the chart to move it.
- Click Fit To Screen to bring the whole chart back into view.
4. Consolidated View and Detailed View
Use the two buttons at the top right of the page to switch views.
| View | What the cards show |
|---|---|
| Consolidated View (default) | Compact cards: picture, name, designation, department and the reportees button |
| Detailed View | Larger cards that also show the extra details you have chosen, for example the employee ID and the TOTAL number of reportees (direct and indirect) |
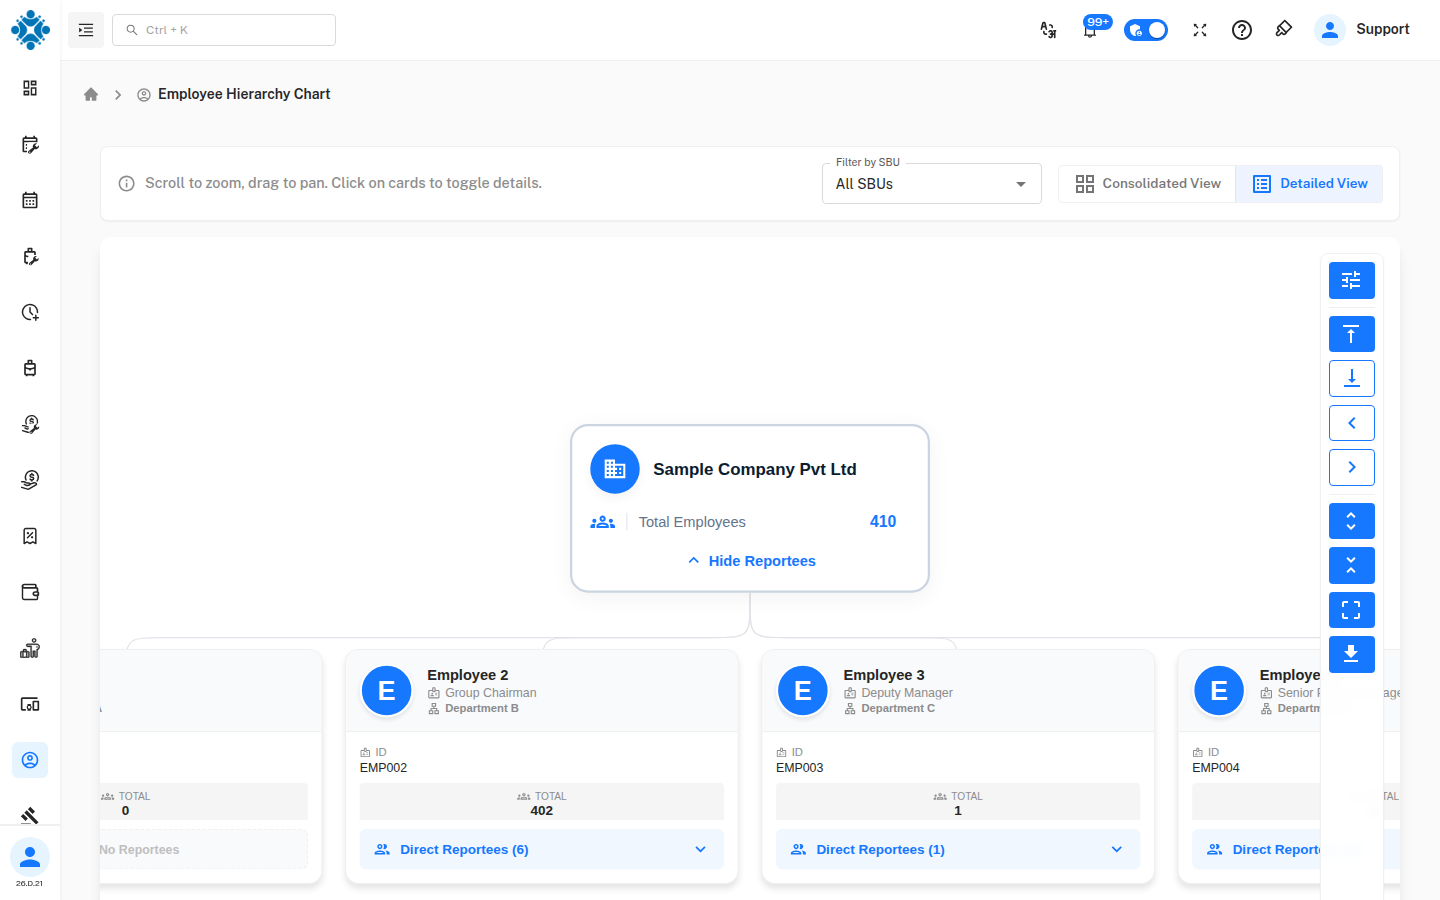
Direct Reportees counts only the people who report straight to the employee. TOTAL counts everyone under them, including their teams' teams.
5. Filter by SBU
By default the chart shows All SBUs. To look at one SBU only:
- Click Filter by SBU.
- Choose an SBU from the list.
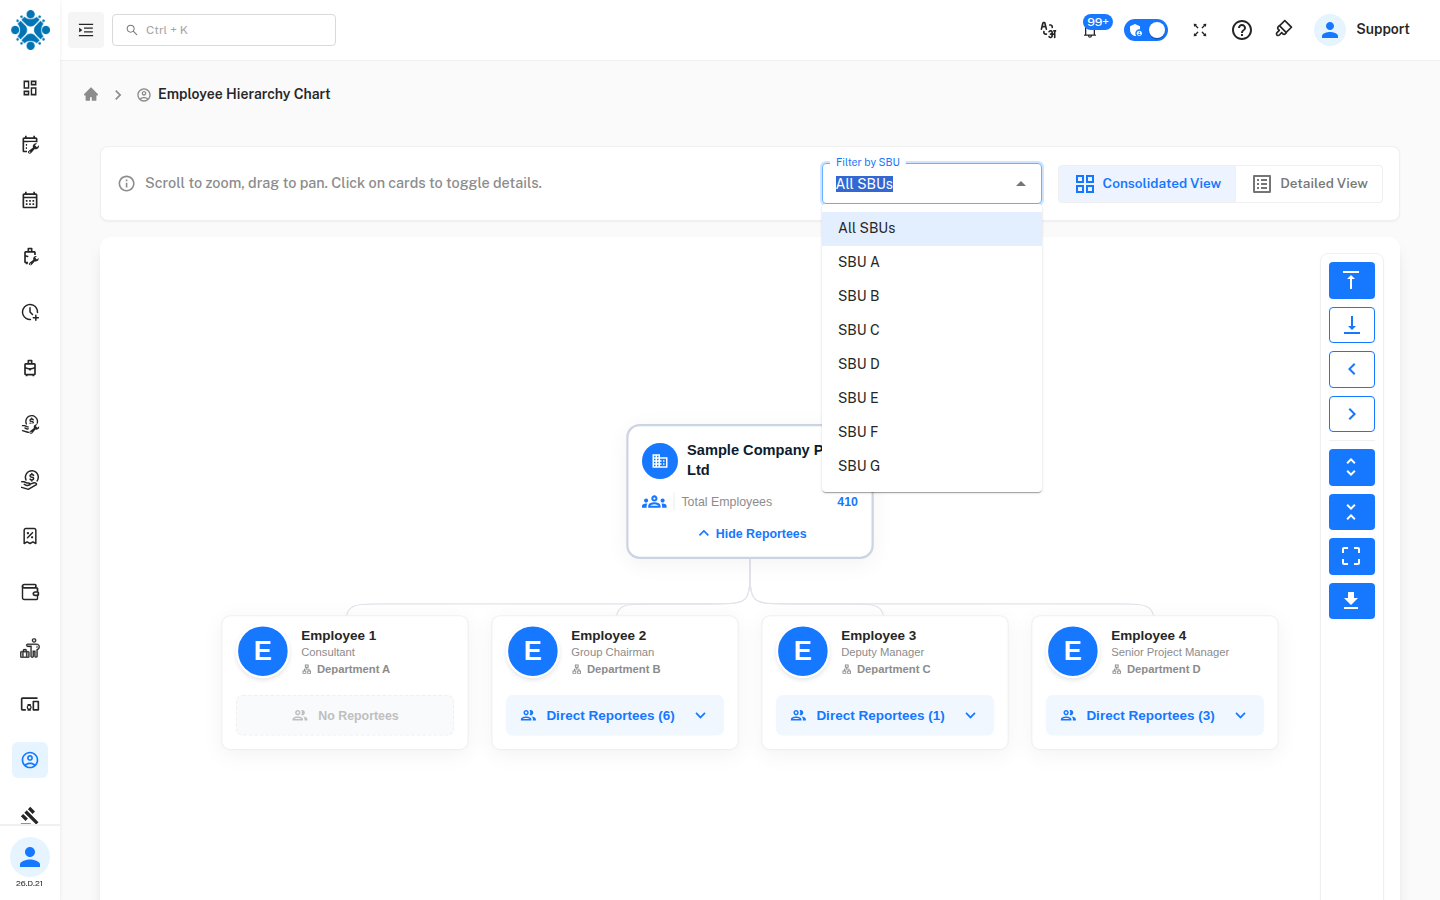
The chart is redrawn for that SBU. The top card shows the SBU name and the Total Employees in it.
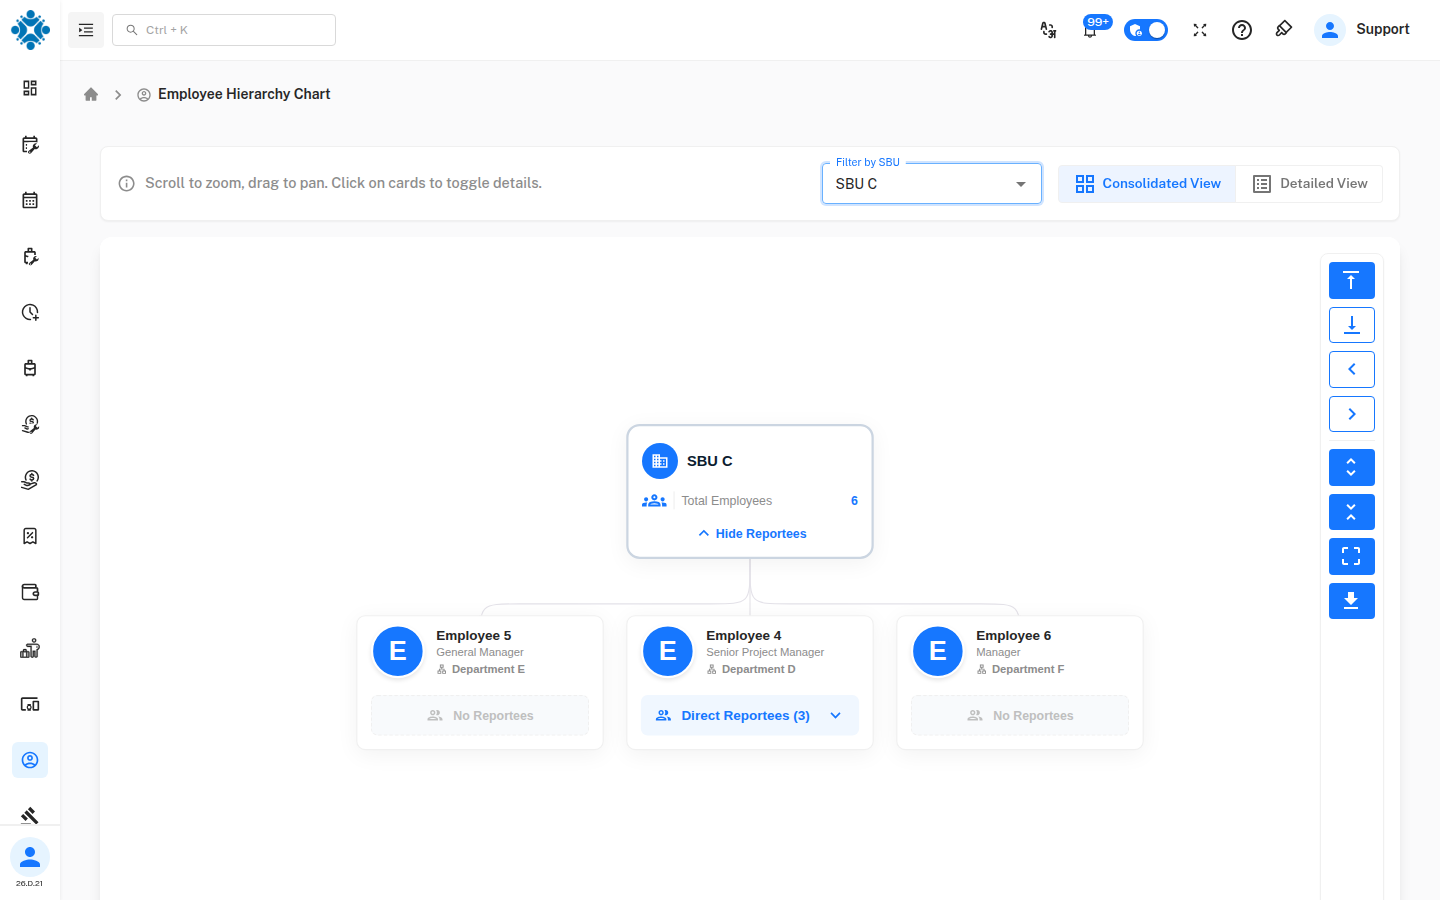
Choose All SBUs to go back to the full chart.
6. Customise Chart
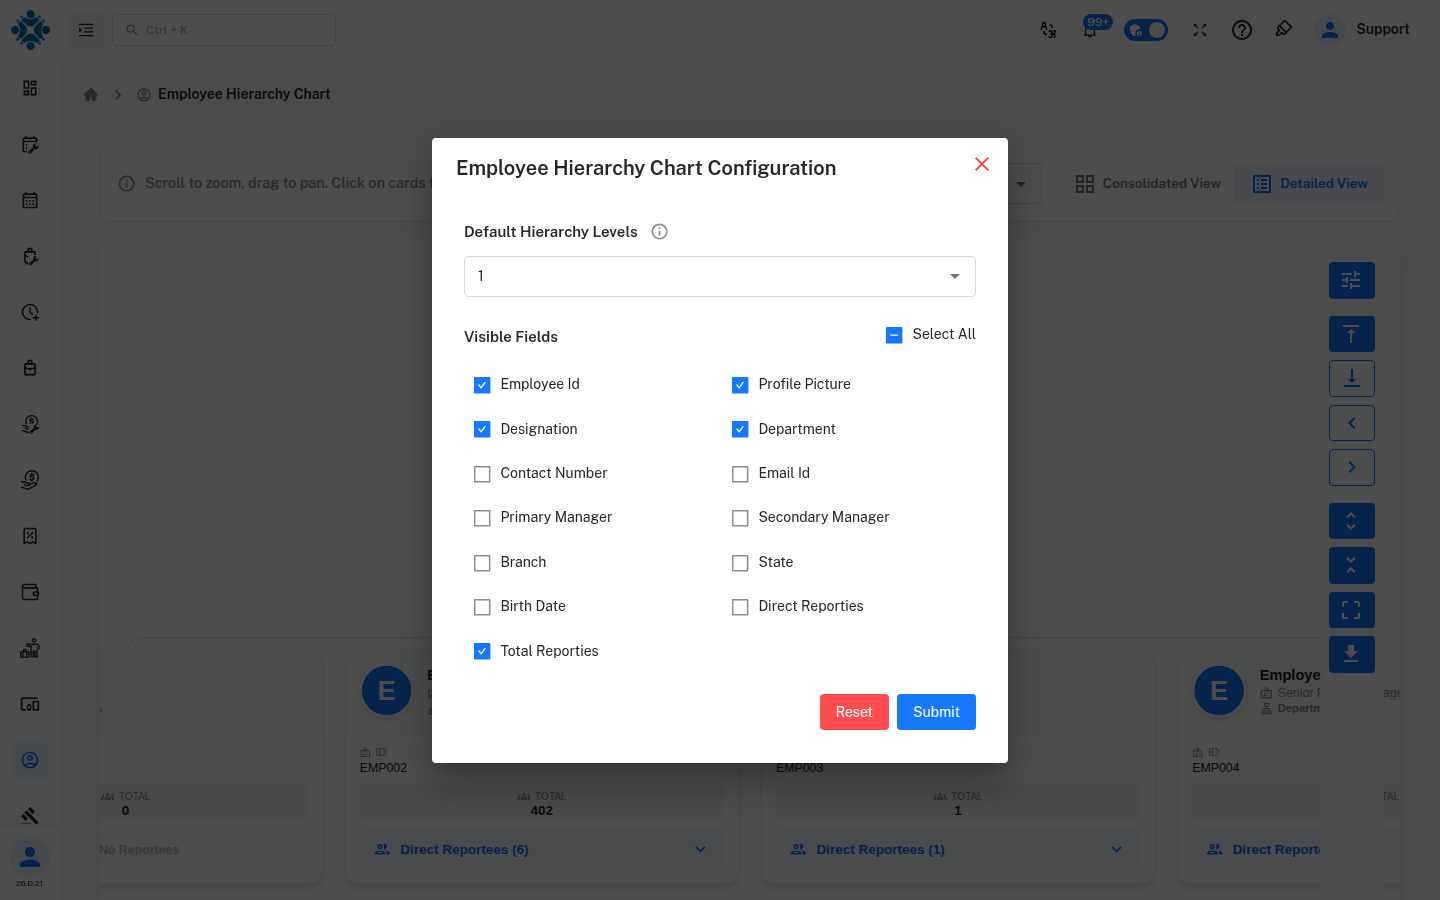
Customise Chart replaces the old Employee Hierarchy Chart Configuration page. It lets you choose how many levels open by default and which details appear on the cards.
Customise Chart appears only in Detailed View. Switch to Detailed View first, then click the button at the top of the control panel (the one with the sliders icon).
Default Hierarchy Levels
Controls how many levels of the hierarchy are shown when the chart opens. Lower values give a summarized view. Infinite shows the complete reporting structure.
| Value | Meaning |
|---|---|
| 0, 1, 2 | Show only that many levels below the company |
| Infinite | Show every level |
You can always open more levels yourself with the Direct Reportees buttons.
Visible Fields
Tick the details you want to see on the cards. Only ticked fields are shown.
| Field | What it shows |
|---|---|
| Employee Id | The employee's ID |
| Profile Picture | The employee's picture or initial |
| Designation | Job title |
| Department | Department |
| Contact Number | Phone number |
| Email Id | Official email address |
| Primary Manager | The employee's primary reporting manager |
| Secondary Manager | The employee's secondary reporting manager |
| Branch | Work location |
| State | State of the work location |
| Birth Date | Date of birth |
| Direct Reporties | Number of employees reporting directly |
| Total Reporties | Number of employees reporting directly or indirectly |
Use Select All to tick or untick every field at once.
Save your choices
| Button | What it does |
|---|---|
| Submit | Saves your choices. A Configuration updated successfully message confirms it |
| Reset | Undoes the changes you made in the pop-up and goes back to the saved choices |
Birth date, phone number and email are personal details. Show them only if your organization needs them on the chart.
7. Control Panel
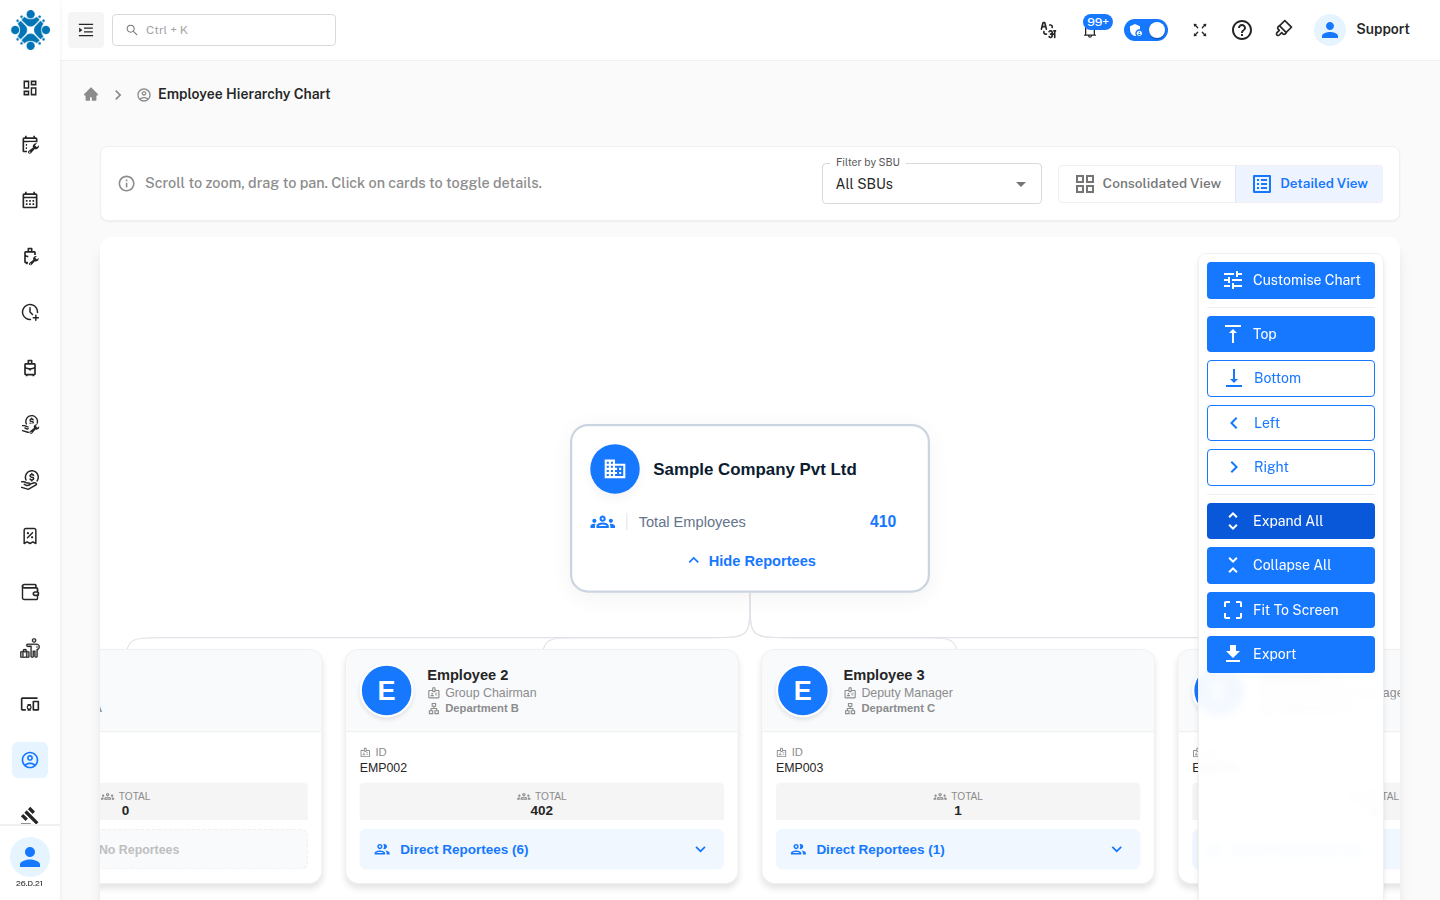
The control panel at the right edge of the chart shows icons only. Move the pointer over it to see the button names.
| Button | What it does |
|---|---|
| Customise Chart | Opens the configuration pop-up (Detailed View only) |
| Top | Lays the chart out from top to bottom (the default) |
| Bottom | Flips the chart so the company is at the bottom |
| Left | Lays the chart out from left to right |
| Right | Lays the chart out from right to left |
| Expand All | Opens every team |
| Collapse All | Closes every team |
| Fit To Screen | Zooms and centers the chart so it fits on the screen |
| Export | Downloads the chart as an SVG image |
8. Data Errors
The chart can only be drawn when every employee has a clear line of managers going up to the top. If your employee data contains a loop in the reporting structure, the chart shows a Data Error: Invalid Reporting Structure page instead.
Typical causes of a loop:
- An employee is set as their own manager
- Two employees report to each other, or a manager reports to someone below them
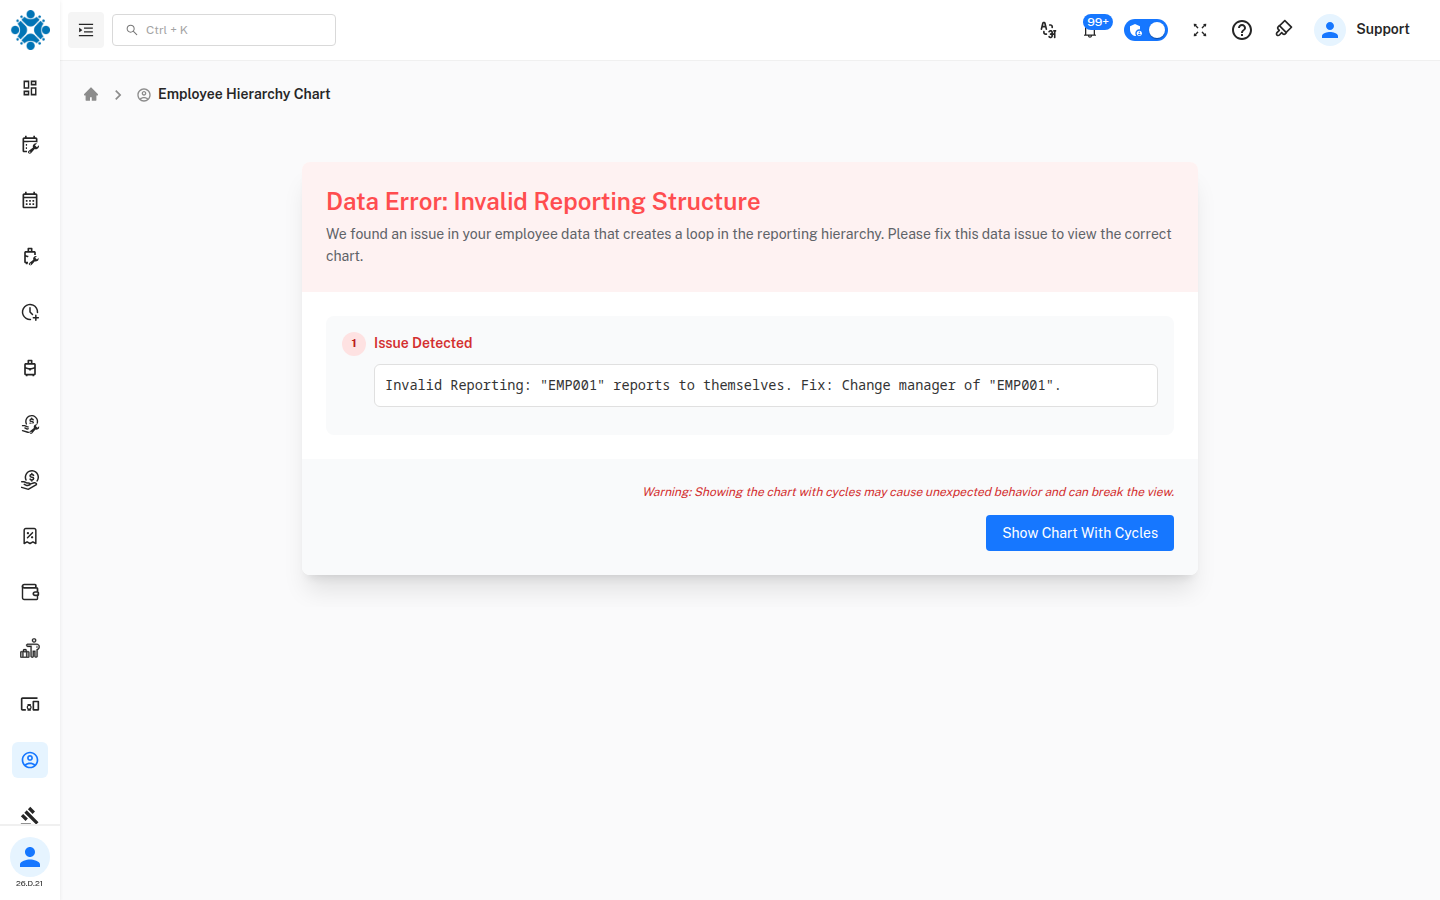
The page tells you how many issues were found and lists each one. Every issue names the employee ID involved and the fix, for example Change manager of "EMP001".
How to fix it
- Note the employee IDs listed under Issue Detected.
- Open each employee's profile and change their reporting manager so the loop is removed.
- Reload the Employee Hierarchy Chart page. When all loops are gone, the chart opens normally.
Show Chart With Cycles
The error page has a Show Chart With Cycles button, with a warning that showing the chart with cycles may cause unexpected behavior and can break the view. In our testing, a chart that contains a loop could not be drawn, and an Oops! Something went wrong message appeared instead.
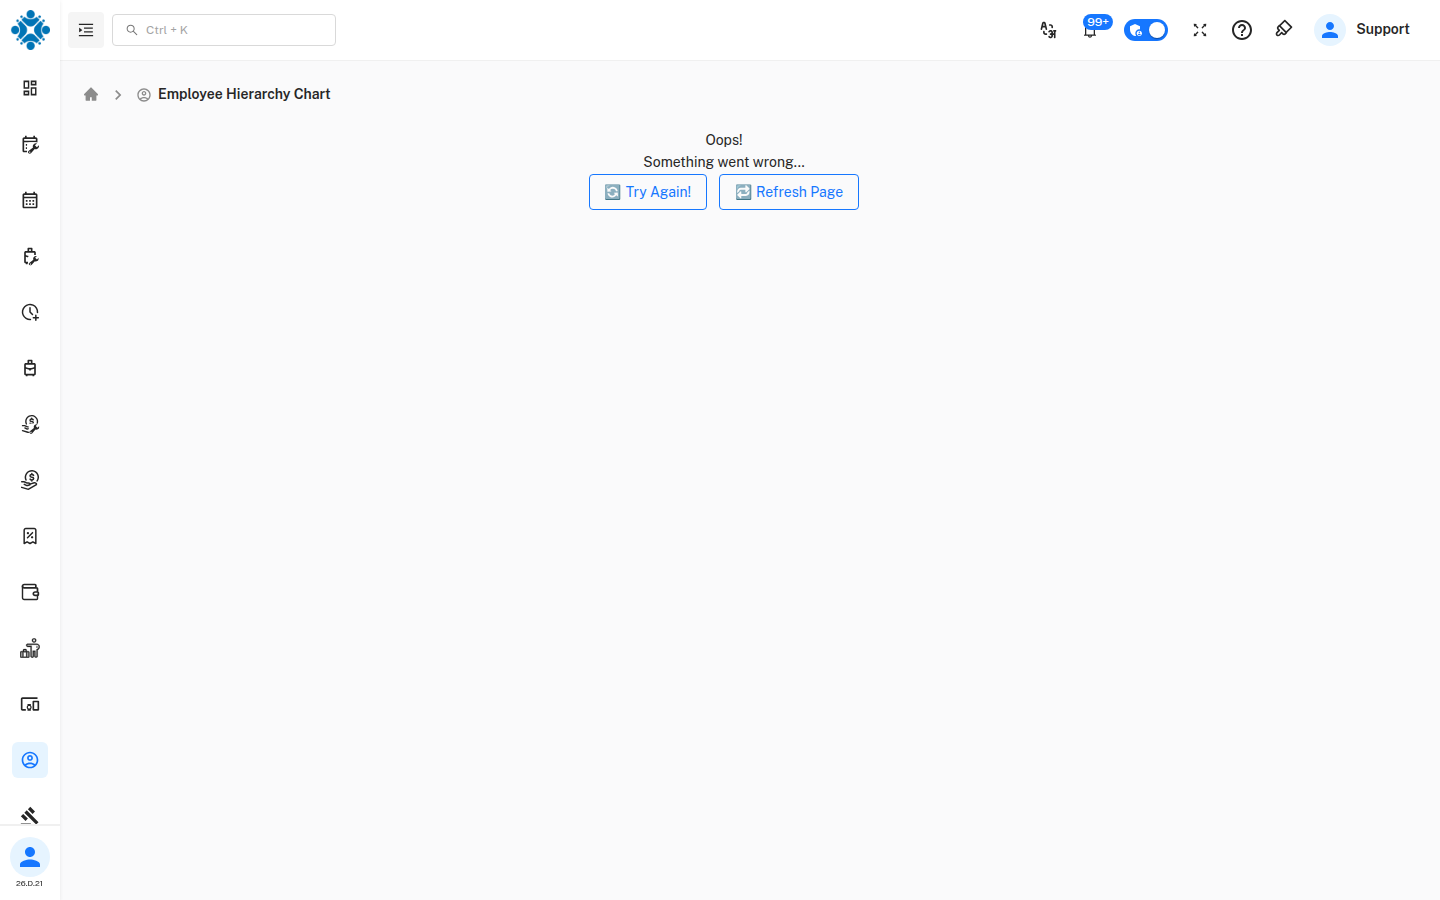
Do not rely on Show Chart With Cycles. Fix the reporting managers listed on the error page instead. Try Again! and Refresh Page only help once the data has been corrected.
9. Export the Chart
Click Export to download the chart as an SVG image. An SVG stays sharp at any size. You can open it in a web browser or a design tool, or insert it into a presentation.
10. Things to Know
- The chart is read-only. You cannot change a reporting relationship on this page.
- The chart is built from each employee's reporting manager in their profile. To change who reports to whom, update the manager in the employee profile and reload the chart.
- If you use Customise Chart, choose the fields carefully so the cards stay readable.
Quick Reference
| I want to… | Do this |
|---|---|
| See one manager's team | Click Direct Reportees (n) on their card |
| See the whole company | Click Expand All, then Fit To Screen |
| Look at one SBU | Choose it in Filter by SBU |
| Show IDs and total reportees | Switch to Detailed View |
| Choose which details appear | Detailed View → Customise Chart |
| Show the chart sideways | Click Left or Right |
| Share the chart | Click Export |
| Fix a "Data Error" page | Change the manager of each employee ID listed, then reload |